一个由 Node.js vm 引发的 OOM 血案
大家在用 Node.js 的 vm 时,可千万小心。冷不丁就哪里埋了坑。有时候补了这里可能又漏了那里。尤其是频繁新建 vm 的时候,例如来一个请求,组合一段代码,放进 vm 中执行。
Talk is Cheap, Show Me the Code
先上一段最小复现代码。
// test.js |
注意:在异步
while中每次循环的末尾都手动调用一次gc()函数。
复现 OOM
首先,我们看看正常的时候应该是怎么样的。大家可以跟着一起用 Node.js 12 执行。
注意:一定是 Node.js 12。
$ node --expose-gc --max-heap-size=100 test.js |
乍一看没什么问题,用 top 查看,内存会涨到约 100M 上下,然后迅速跌到非常小的值,如此循环往复。事实上,它就是没什么问题。
但问题坏就坏在 Node.js 14 和 16 上。至少在 V8 修复这个 Bug 之前(甚至很有可能 V8 不会认为这是个 Bug)的 Node.js 14 和 16 版本都会有这个问题。
这里,我用 Node.js 14.16.0 以及 16.8.0 进行实验。不排除后续版本会修复这个问题。
依旧是上面那段脚本:
$ node --expose-gc --max-heap-size=100 test.js |
感觉像在玩恐怖游戏一样,一人站一个角,跑着跑着,就跑没了。并留下了一段话:
<--- Last few GCs ---> |
看吧,莫名其妙 OOM 了。
真相还原
造成这个问题的原因有好几个,缺一不可。就像东方列车案件一样,一人来一刀。我们一一解析。
V8 Compilation Cache
缓存技术
首先,第一刀就是 V8 的 Compilation Cache。这个 Compilation Cache 跟我们日常熟知的 vm API 中的 cachedData 不一样。它是更底层的一个缓存 Hash 表,整个 V8 Isolate 共用一份,以传进去的源码字符串本身作为 key 进行查找和存储。
在 Node.js 的 vm 中编译(或者说解释)一段脚本时,最终依赖的对象叫 UnboundScript。这是一个尚未绑定至 Context 的脚本对象。在编译过程中,会逐步调用至以下代码:
... |
用人话解释就是:用源码去检索 Compilation Cache 中是否存在相同 key 的对象。若存在,直接返回已经存在的缓存;否则,正常进行反序列化,并将结果储存在 Compilation Cache 中(V8 分配的堆内存上),并由源码字符串作为 key。
根据观察得出的结论,这种缓存技术在真实世界的网页中能够达到 80% 的命中率。并且由于这种缓存直接存在于内存中,所以它的速度会比较快。
虽然 Node.js 并不是 Chrome,但它也用了 V8,所以这个 Compilation Cache 也同样存在。
我们可以在一开始的源码中加入点料来验证这一点:在 times++ 一行之后加入:
if (times === 330) require('v8').writeHeapSnapshot(require('path').join(__dirname, 'temp.heapsnapshot')); |
这样,当执行了 330 次循环后,会在当前目录下生成一个 temp.heapsnapshot 的 Heap dump 文件。再执行这个脚本,会发现它在 OOM 之前保留了一份现场。用 Chrome 的开发者工具打开这个 Heap dump 文件,我们可以发现:
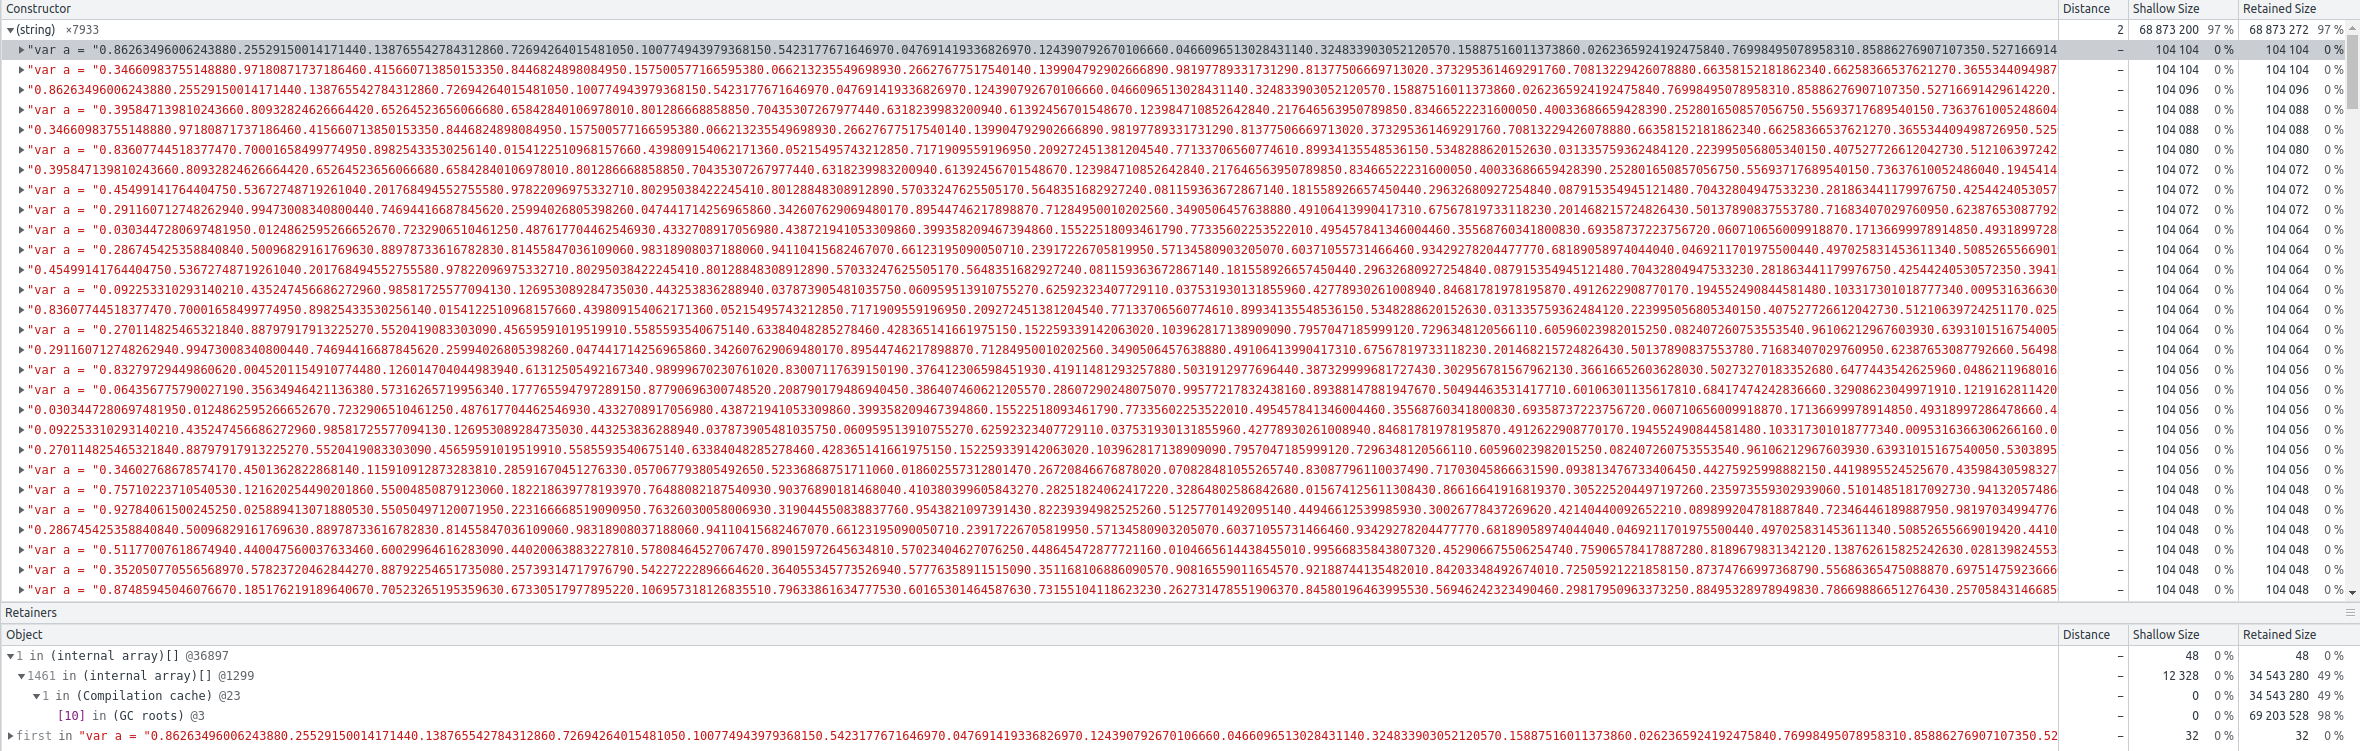
字符串有将近 8000 个,别的一些不重要——我们可以看到有不少源码字符串根本没有被回收,而一个动辄 100K。而从下方 Object 一栏中可以看到,其都属于 Compilation Cache。
这说明了,哪怕我们手动执行了 gc(),这些 Compilation Cache 中的内容(如源码字符串)并没有被回收。
缓存 GC 机制
根据上面的实验结果,我们不能武断地认为其不会被回收。事实上 Compilation Cache 也是在 GC 策略里面的。只不过它的策略与一般的 V8 JavaScript 对象不同。而且事实上,不管是 Node.js 12 所使用的 V8(v7.x)还是 Node.js 14 / 16 所使用的 V8(v8.x / v9.x),Compilation Cache 的回收策略是一样的。
想想 Node.js 12 执行这段代码的结果:内存会涨到约 100M 上下,然后迅速跌到非常小的值,如此循环往复。
也就是说,V8 堆内存到达上限后,会对 Compilation Cache 进行回收。我们可以验证一下,在执行的命令行上面加一个参数:
$ node --trace-gc --expose-gc --max-heap-size=100 test.js |
然后继续在 Node.js 12 下执行,就能得到类似这样的输出:
... |
即内存一路上涨,等到涨到顶的时候,GC 报了个问题:
allocation failure GC in old space requested
老生代空间不够申请了。然后触发了下一条 GC:
last resort GC in old space requested
这是一条 Last Resort GC,在该次 GC 之后,整体的内存又降到了一个非常低的水位。
对的,这就是 V8 的策略。我们知道 V8 的 GC 策略中,有一步是将新生代的内存给迁移到老生代去的。这个时候需要从老生代空间申请内存。若申请不到,就执行一次 Last Resort GC。我们可以看看 Node.js 14 / 16 的结果:
[2433812:0x4743cd0] 5820 ms: Mark-sweep 72.3 (92.1) -> 71.8 (92.1) MB, 5.7 / 0.0 ms (average mu = 0.723, current mu = 0.701) testing GC in old space requested |
一直是 testing GC in old space requested,没等到进行 Last Resort 就挂了。
知道差别之后,我们先来看看 Last Resort GC 到底做了些什么:
void Heap::CollectAllAvailableGarbage(GarbageCollectionReason gc_reason) { |
首先,Heap 中有三个 GC 函数,CollectGarbage、CollectAllGarbage(),还有一个就是上面的 CollectAllAvailableGarbage()。其中 CollectAllGarbage() 基本等同于调用指定参数下的 CollectGarbage()。通常情况下,Testing GC 就是调用的 CollectAllGarbage(),而 Last Resort 的 GC 只会调用 CollectAllAvailableGarbage()。我们看到这个 CollectAllAvailableGarbage() 中就有清除 Compilation Cache 的逻辑。
这就与它的作用相符了。
“last resort gc” means that there was an allocation failure that a normal GC could “resolve”.
当有堆内存分配失败(到达上限)时,V8 会以 Last Resort 为由做一次 CollectAllAvailableGarbage() 的 GC,看看能不能把杂七杂八的各种没用的东西都回收掉。如果回收了之后,仍无法分配,那就只能干瞪眼并触发进程崩溃了。
而 Compilation Cache 的 GC 机制,就是 CollectAllGarbage() 不会回收它(就是我们看到从 Trace GC 中看到的 testing GC in old space requested),只有 CollectAllAvailableGarbage() 才会将其回收。而 CollectAllAvailableGarbage() 调起的理由之一就是 Last Resort,即尝试分配堆内存失败时(也就是堆内存到达上限了)。
这就是为什么在 Node.js 12 中,这段代码会一直涨到 100M 左右,然后内存分配失败,接着执行 Last Resort GC,最后内存掉下来。
临时解法
知道了这里有问题之后,我们就可以临时解决这个问题了。其实只要把 Compilation Cache 禁掉就可以了。
$ node --trace-gc --expose-gc --max-heap-size=100 --no-compilation-cache test.js |
老生代内存分配失败逻辑
我们在上一节中粗略介绍了 Last Resort 这种 GC 的时机。那么它到底是如何运作的呢。看看下面这段 V8 代码:
HeapObject Heap::AllocateRawWithRetryOrFailSlowPath( |
这是 Node.js 14 对应的 V8 代码,我已将一些关键注释标上,大家应该都能看懂。实际上 Node.js 12 基本一样,就是函数名有点不一样。总得来讲非常简单,就是尝试分配,若失败就 Last Resort GC,再次尝试分配,若还失败则 OOM 崩溃。
其实在第一次分配失败之前,它的依赖函数 AllocateRawWithLightRetrySlowPath() 还有个小 Trick:
HeapObject Heap::AllocateRawWithLightRetrySlowPath( |
整体连起来就是,如果分配内存失败,则先尝试两次 CollectGarbage()。这种做法就已经可以解决大多数的内存分配失败的问题了。若两次 CollectGarbage() 还无法清理出内存,则再尝试一次 CollectAllAvailableGarbage()。
实际上,Node.js 12、14 和 16 的 V8 在堆内存分配失败时的 GC 策略都一样,都是上面的逻辑。分配失败了,先尝试进行几次不一样的 GC,真不行了再最终 OOM。
既然一样,为什么 Node.js 12 好好的,而 Node.js 14 和 16 就会挂呢?
--always-promote-young-mc
在 V8 的 v8.0.1 版本中,其引入了一个新的 Flag——--always-promote-young-mc。我愿称之为推陈出新。Node.js 14 用的就是 V8 的 v8.* 版本。
Add FLAG_always_promote_young_mc that always promotes young objects during a Full GC when enabled. This flag guarantees that the young gen and the sweeping remembered set are empty after a full GC.
This CL also makes use of the fact that the sweeping remembered set is empty and only invalidates an object when there were old-to-new slots recorded on its page.
每次 Full GC 的时候,这个 Flag 会保证在 GC 之后的新生代空间等为空,新生代的对象会全迁移至老生代。
我们看看它在代码中的实际作用吧。
... |
当 --always-promote-young-mc 打开的时候,每次 Full GC 都会尝试往老生代迁移。既然要迁移,肯定是要先老生代申请一块内存,才能迁移。若此时老生代内存申请失败(堆内存达到上限),则直接抛出 OOM 错误:MarkCompactCollector: young object promotion failed。这个错误跟我们用 Node.js 14 执行代码最终的输出对上了。而这个 TryEvacuateObject() 最后兜兜转转会调用我们在之前提到的 AllocateRaw() 函数(AllocateRawWithLightRetrySlowPath() 中调用的也是这个)了。
所以,整条崩溃链就是:
- 由于 Compilation Cache 的机制,一直不会被回收,直到堆内存上限;
- GC 的时候,由于
--always-promote-young-mc开关打开,所以执行推陈出新操作; - 推陈出新的时候,由于堆内存到达上限,无法申请更多的老生代内存,导致 OOM 崩溃。
这简直就是一个死锁。至于 V8 到底认为这个是个 Bug 还是个 Feature,那我就不知道了。Bug 我是提了,大家可以跟我一起跟进。
临时解法
我们明白了 --always-promote-young-mc 会导致目前的 Bug。那就跟之前 Compilation Cache 临时解法一样,将其关掉即可。
$ node --expose-gc --max-heap-size=100 --no-always-promote-young-mc test.js |
看!一切……别高兴太早。

设置了似乎并没什么用。这又是为什么呢?
--array-buffer-extension
这又是一个 V8 的 Flag。与别的 Flag 不同的是,它这一个只读的 Flag,且是在编译时就指定了的。
虽然这个 Flag 在之前就有,但是在 V8 的 v8.3 版本中,为这个 Flag 做了一次性能提升。
Backing stores of ArrayBuffers are allocated outside V8’s heap using ArrayBuffer::Allocator provided by the embedder. These backing stores need to be released when their ArrayBuffer object is reclaimed by the garbage collector. V8 v8.3 has a new mechanism for tracking ArrayBuffers and their backing stores that allows the garbage collector to iterate and free the backing store concurrently to the application. More details are available in this design document (https://docs.google.com/document/d/1-ZrLdlFX1nXT3z-FAgLbKal1gI8Auiaya_My-a0UJ28/edit#heading=h.gfz6mi5p212e). This reduced total GC pause time in ArrayBuffer heavy workloads by 50%.
有兴趣的小可爱们可以自行去看看上面提到的设计文档。总之来说,在 V8 的 v8.3 版本之后,打开这个开关可以提高 ArrayBuffer 约 50% 的性能。
正是因为这样,Node.js 在 v14.5.0 中就将这个开关在编译时由关闭状态变成了打开状态。(https://github.com/nodejs/node/commit/2c59f9bbe29df1ee3e714671de1433369992eba7#diff-d53f68b29a1c48c958c2e6779cc25c916a986357c6010dd01421c17adcf2f09bR150)
别以为我扯远了。这个 Flag 与 --always-promote-young-mc 息息相关。在 V8 中,Flag 们有相互依赖的关系。
DEFINE_IMPLICATION(array_buffer_extension, always_promote_young_mc) |
上面的宏的展开的意思就是说:
- 若
--array-buffer-extension开关处于关闭状态,则--always-promote-young-mc可为任意值; - 若
--array-buffer-extension开关处于开启状态,则--always-promote-young-mc会被强制开启。
也就是说,哪怕你自己 --no-always-promote-young-mc,由于 Node.js 在编译时就将 --array-buffer-extension 开关打开,--always-promote-young-mc 也会被强制开启。
大家可以试试看早于 Node.js 14.5.0 的版本,那个时候 Node.js 的 --array-buffer-extension 开关还处于关闭状态。也就是说,在该版本中,我们是可以通过执行:
$ node --expose-gc --max-heap-size=100 --no-always-promote-young-mc test.js |
来规避这个问题的。Node.js 14.5.0 之后,开关打开,你就关不掉了。
小结
导致该 OOM 有几个问题:
- vm 依赖
UnboundScript,其依赖 V8 Compilation Cache,该 Cache 只有在CollectAllAvailableGarbage()时才会被回收,导致内存一直上涨; - Node.js 14 / 16 对应的 V8 在堆内存抵达上限后 GC 会触发 OOM 的“Bug”;
- Compilation Cache 可被
--no-compilation-cache关闭,但如此一来则无法享受 Compilation Cache;GC 的 OOM 无法通过--no-always-promote-young-mc关闭,因为其前置开关被 Node.js 在编译时强制开启。
解决办法
说了那么多,临时解决办法其实已经贴在各小节中了。要问我最终解决办法是什么,就俩:
- 跟我一起跟进这个 V8 的“Bug”;https://bugs.chromium.org/p/v8/issues/detail?id=12198
- 避免这种频繁 vm 的场景。
彩蛋
即使在 Node.js 14 / 16 下,若我们使用 Inspector 进入进程调试,那么一切表现又正常了。因为 Inspector 的一些策略会不一样,GC 自然也不一样。有兴趣的小可爱们可自行去探查一番。